Self-hosted network monitoring
Complete network visibility, on infrastructure you control.
Monitor switches, servers, applications and cloud services from a single console, with alerting that reaches the right team.
30-day trial. Free for up to 100 sensors after that.
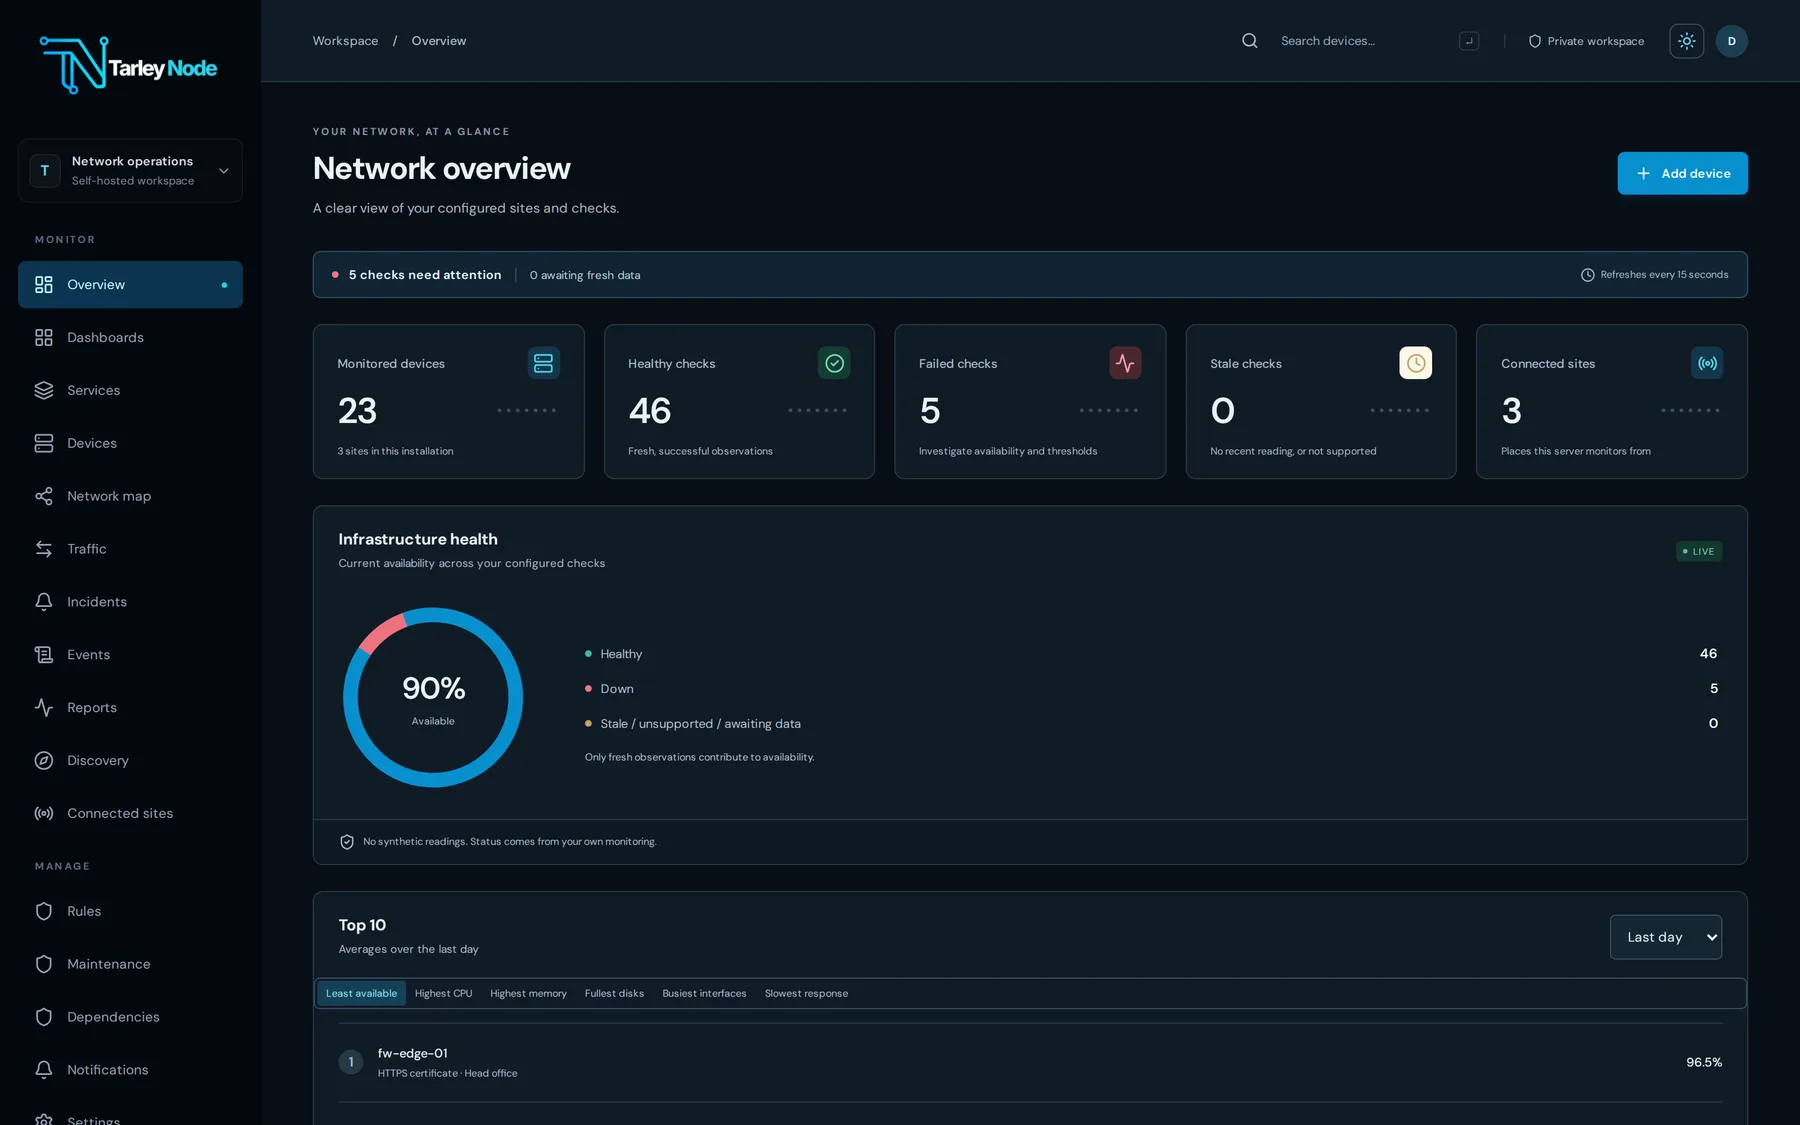
- DeploymentDeployed on your own Linux server
- ArchitectureAgentless by design
- ScaleCentralised visibility across every site
- AlertingEscalation until an alert is acknowledged
Monitoring coverage
Comprehensive coverage across your infrastructure.
TarleyNode monitors your existing estate over the standard protocols it already supports, with no software to install on the devices themselves.
Network devices
Interface status, bandwidth, errors, CPU, memory and uptime via SNMP v2c and v3.
Servers
Linux health via SSH or SNMP, with services via SSH. Windows health, services and performance counters via WinRM.
Websites and applications
HTTP and HTTPS availability, certificate expiry, DNS records, TCP ports, mail services and multi-step web transactions.
Databases
Availability and response time for SQL Server, MySQL and PostgreSQL.
Virtualisation
VMware vCenter, ESXi and Microsoft Hyper-V, with Proxmox VE, XCP-ng, Citrix Hypervisor and Nutanix in beta.
Cloud services
Microsoft Azure and AWS resources, together with Microsoft 365 service health.
Traffic and events
NetFlow, IPFIX and sFlow traffic analysis, with syslog and SNMP trap reception.
Custom integrations
Custom sensors for REST APIs and scripts, with support for existing Nagios plugins.
Inside TarleyNode
The console your team works in every day.
Screens from the TarleyNode console, shown on a demonstration network.
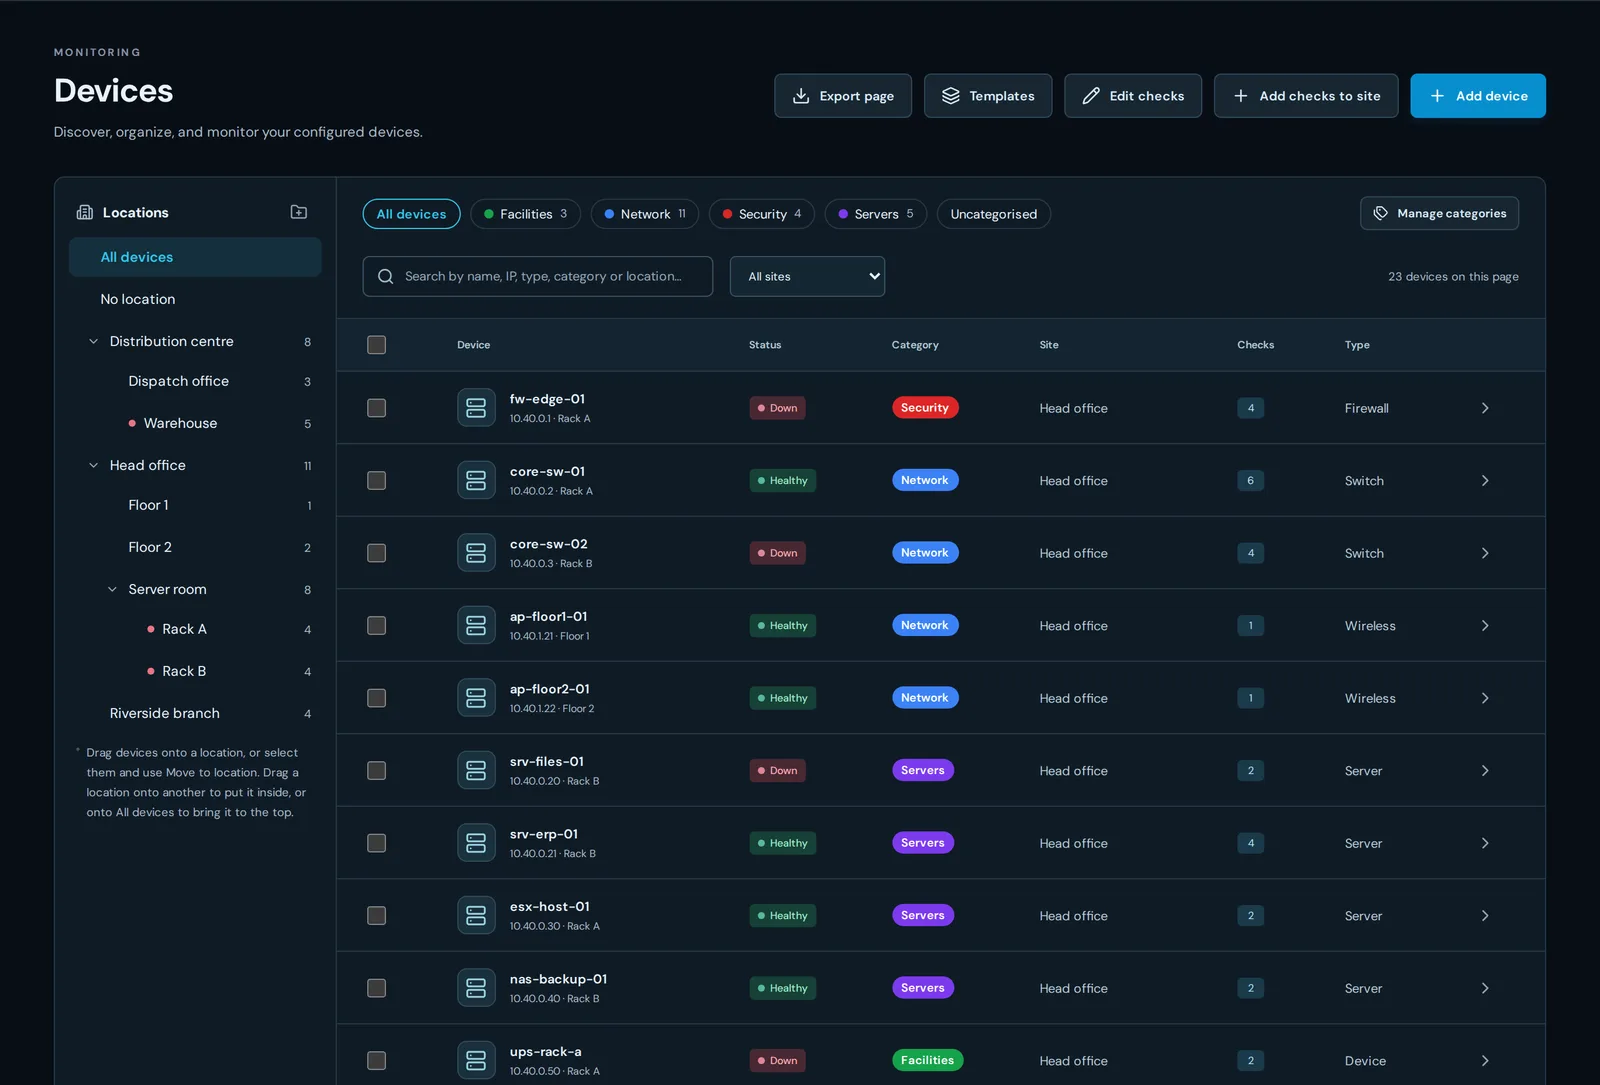
Devices by location
Organise devices into a hierarchy of buildings, floors and racks, with status and checks visible at a glance.
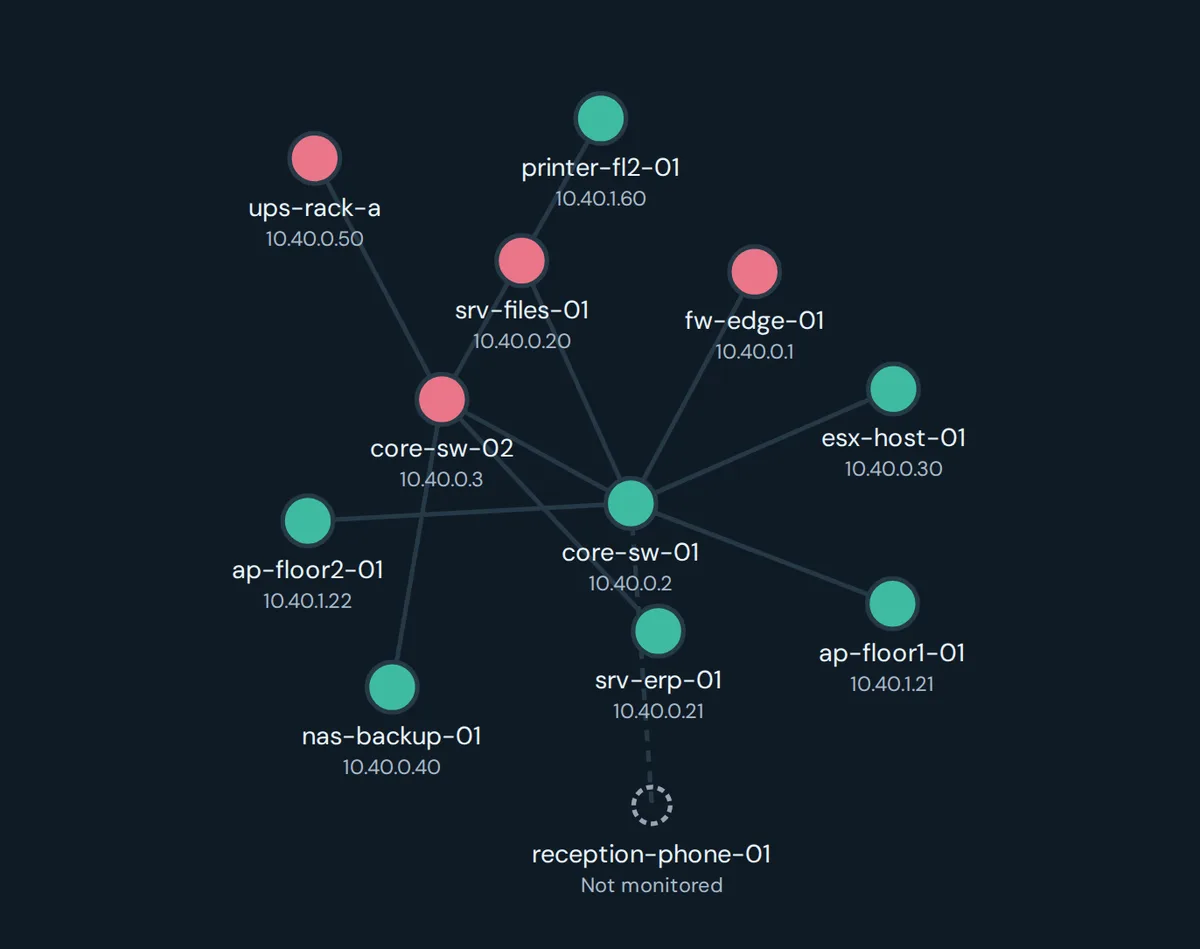
Network topology map
Links discovered via LLDP and CDP, coloured by health.
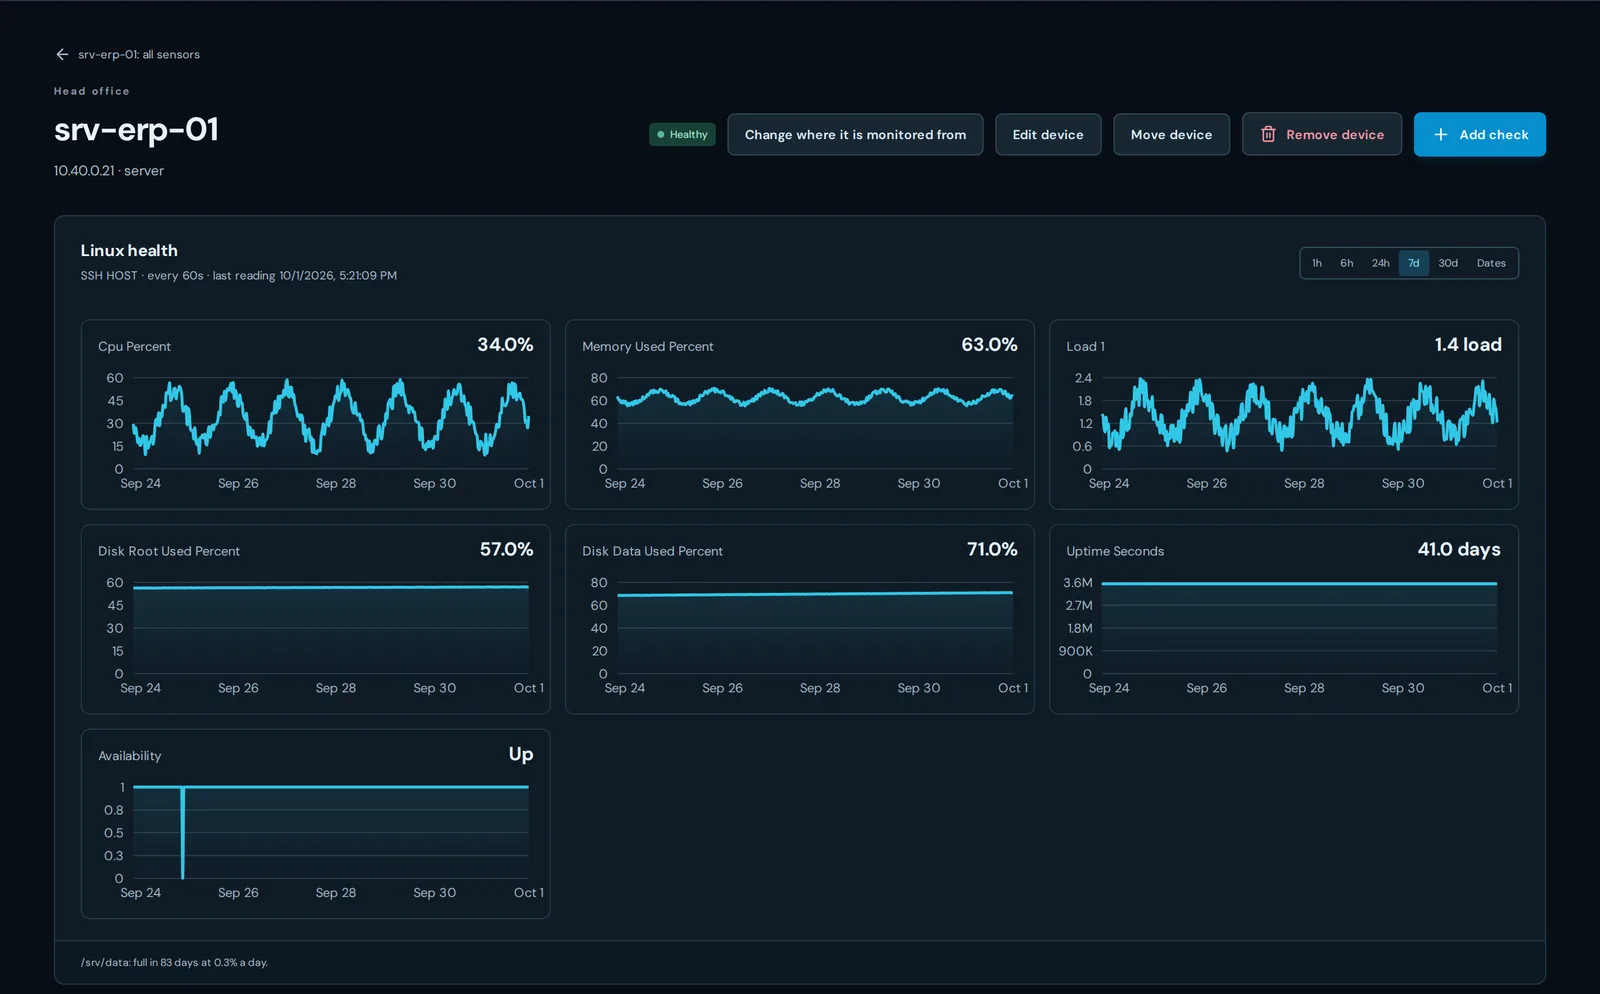
Historical performance
CPU, memory, load, disk and uptime for a Linux server over the past seven days.
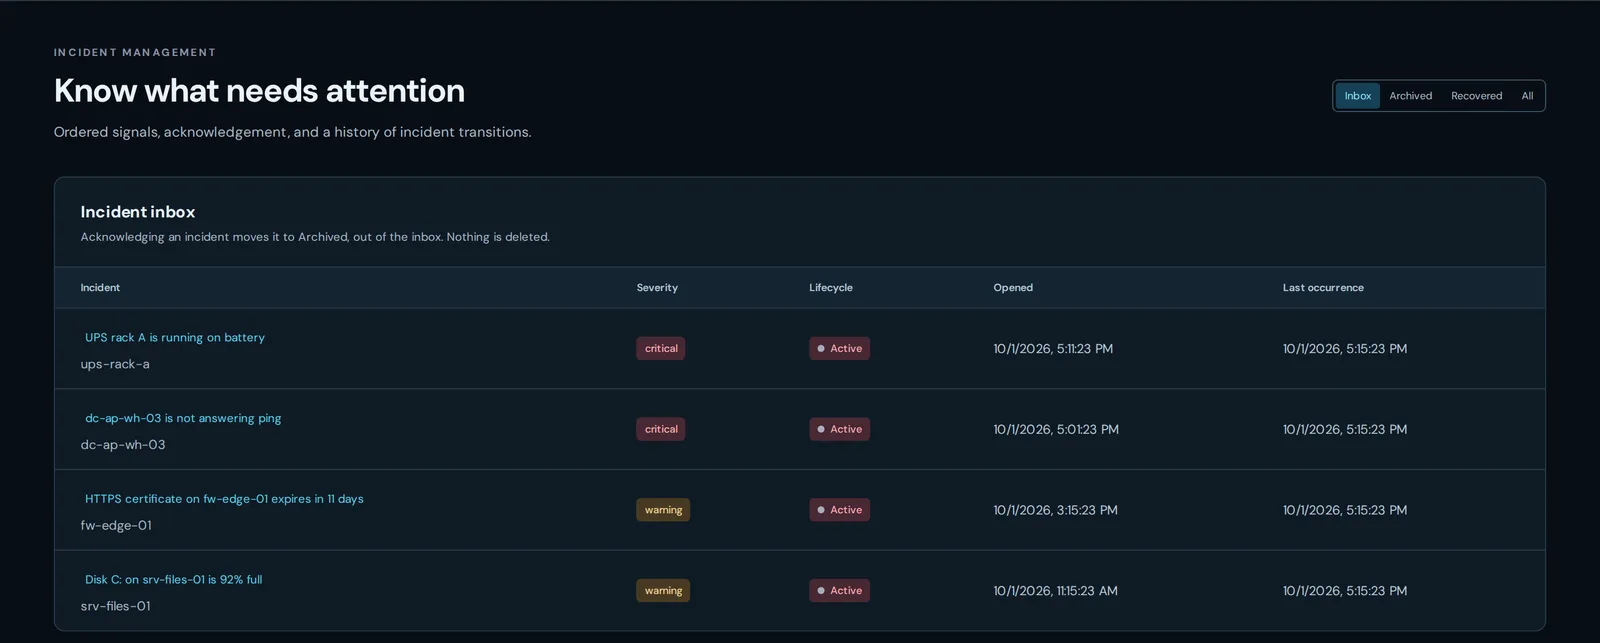
Unified incident inbox
What requires attention, its severity and when it began. Acknowledged incidents are archived.
Deployment
One server for every location.
Host the console on your own infrastructure and bring remote locations into view without exposing individual devices to the internet.
- Devices and servicesMonitored locally at each site
- Connected sitesAdded with a single command
- Central TarleyNode serverUnified console, alerting and history
No agents on monitored devices. Connected sites retain results on disk if their link is interrupted.
Day-to-day operations
From first alert to management reporting.
Reduce alert noise, notify the right people and demonstrate how services have performed.
- Detect
- Thresholds, consecutive-failure rules, dependencies and maintenance windows ensure every alert is meaningful.
- Respond
- Escalation by site and severity to email, Microsoft Teams, Slack, PagerDuty, Telegram, SMS, Jira, ServiceNow or webhooks.
- Report
- Dashboards, a NOC display, public status pages and scheduled availability reports.
Licensing
Free for up to 100 sensors.
Evaluate every feature with unlimited sensors for 30 days. TarleyNode then continues free for up to 100 sensors, with paid licences from $600 a year and unlimited users on every tier.
Approximately a quarter of the cost of comparable sensor-based products.